Theory
The premise of this tutorial is to find the transition state and activation energy (EA) of a mechanistic step for a chemical mechanism. When we describe the energy of a chemical mechanism, we often think of something like what is shown below. However, when initially figuring out the energy of the transition state, we don't know anything about the transition state structure or the energy profile of the mechanism. It is a bit like a computer game (like Age of Empires), where the user has to explore the map to be able to see what the map looks like.
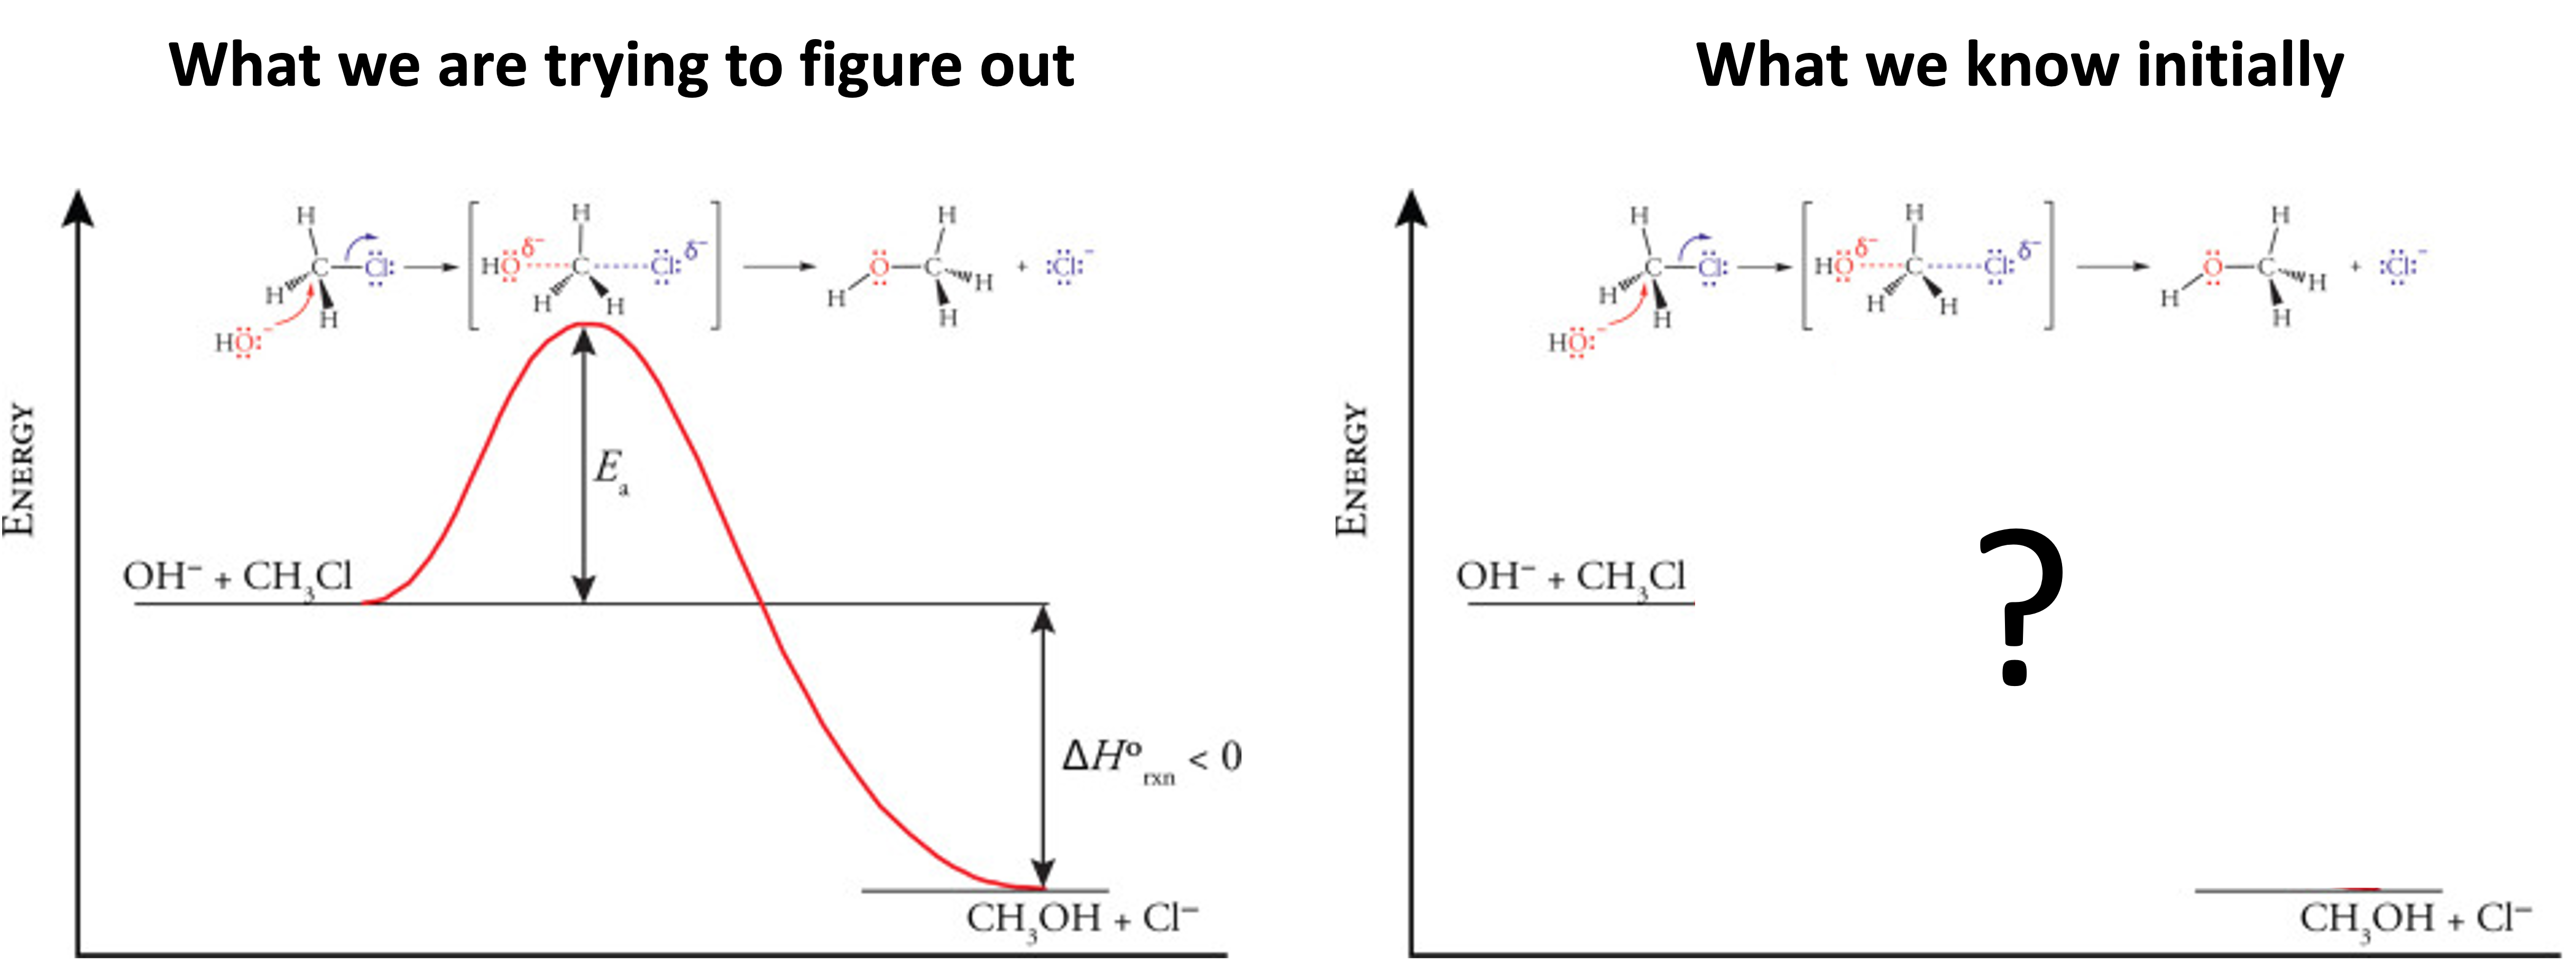
In this tutorial, we will look at how we explore and discover the energy profile for a mechanistic step, focussing on locating the transition state and its activation energy.
There are four general steps that we follow to obtain the transition state of a mechanistic step. These are:
- Locally optimise the reactants and products to their ground state.
- Obtain the transition state by using either the SCAN or NEB method.
- Optimise the transition state.
- Validate the transition state using the IRC method.
There is also a fifth step, which is to compile the results to get the activation energy of the transition state.
In this page, we will cover why we do each step.
Tip
It is not crucial to read through this page before beginning this tutorial. This page is here to help you understand why you do these steps to obtain the transition state for a mechanistic step.
I would recommend that you come back to each theory section as you perform each of the steps, rather than reading the theory section fully before moving on.
The Potential Energy Surface
To begin the theory section, we need to talk about what a potential energy surface is. The potential energy surface is a concept in physical chemistry that describes how the energy of a chemical system changes as you change the relative positions of the atoms in the chemical system. It is a helpful concept to visualise because it nicely describes how the energy of a chemical system changes as the molecules change and react with each other.
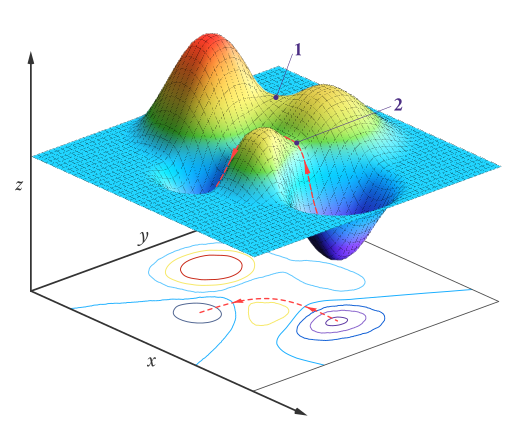
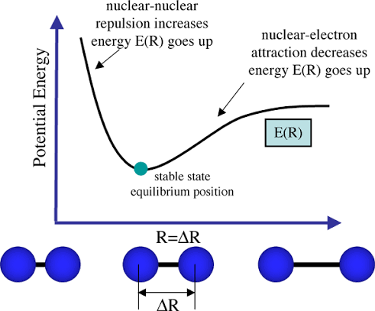
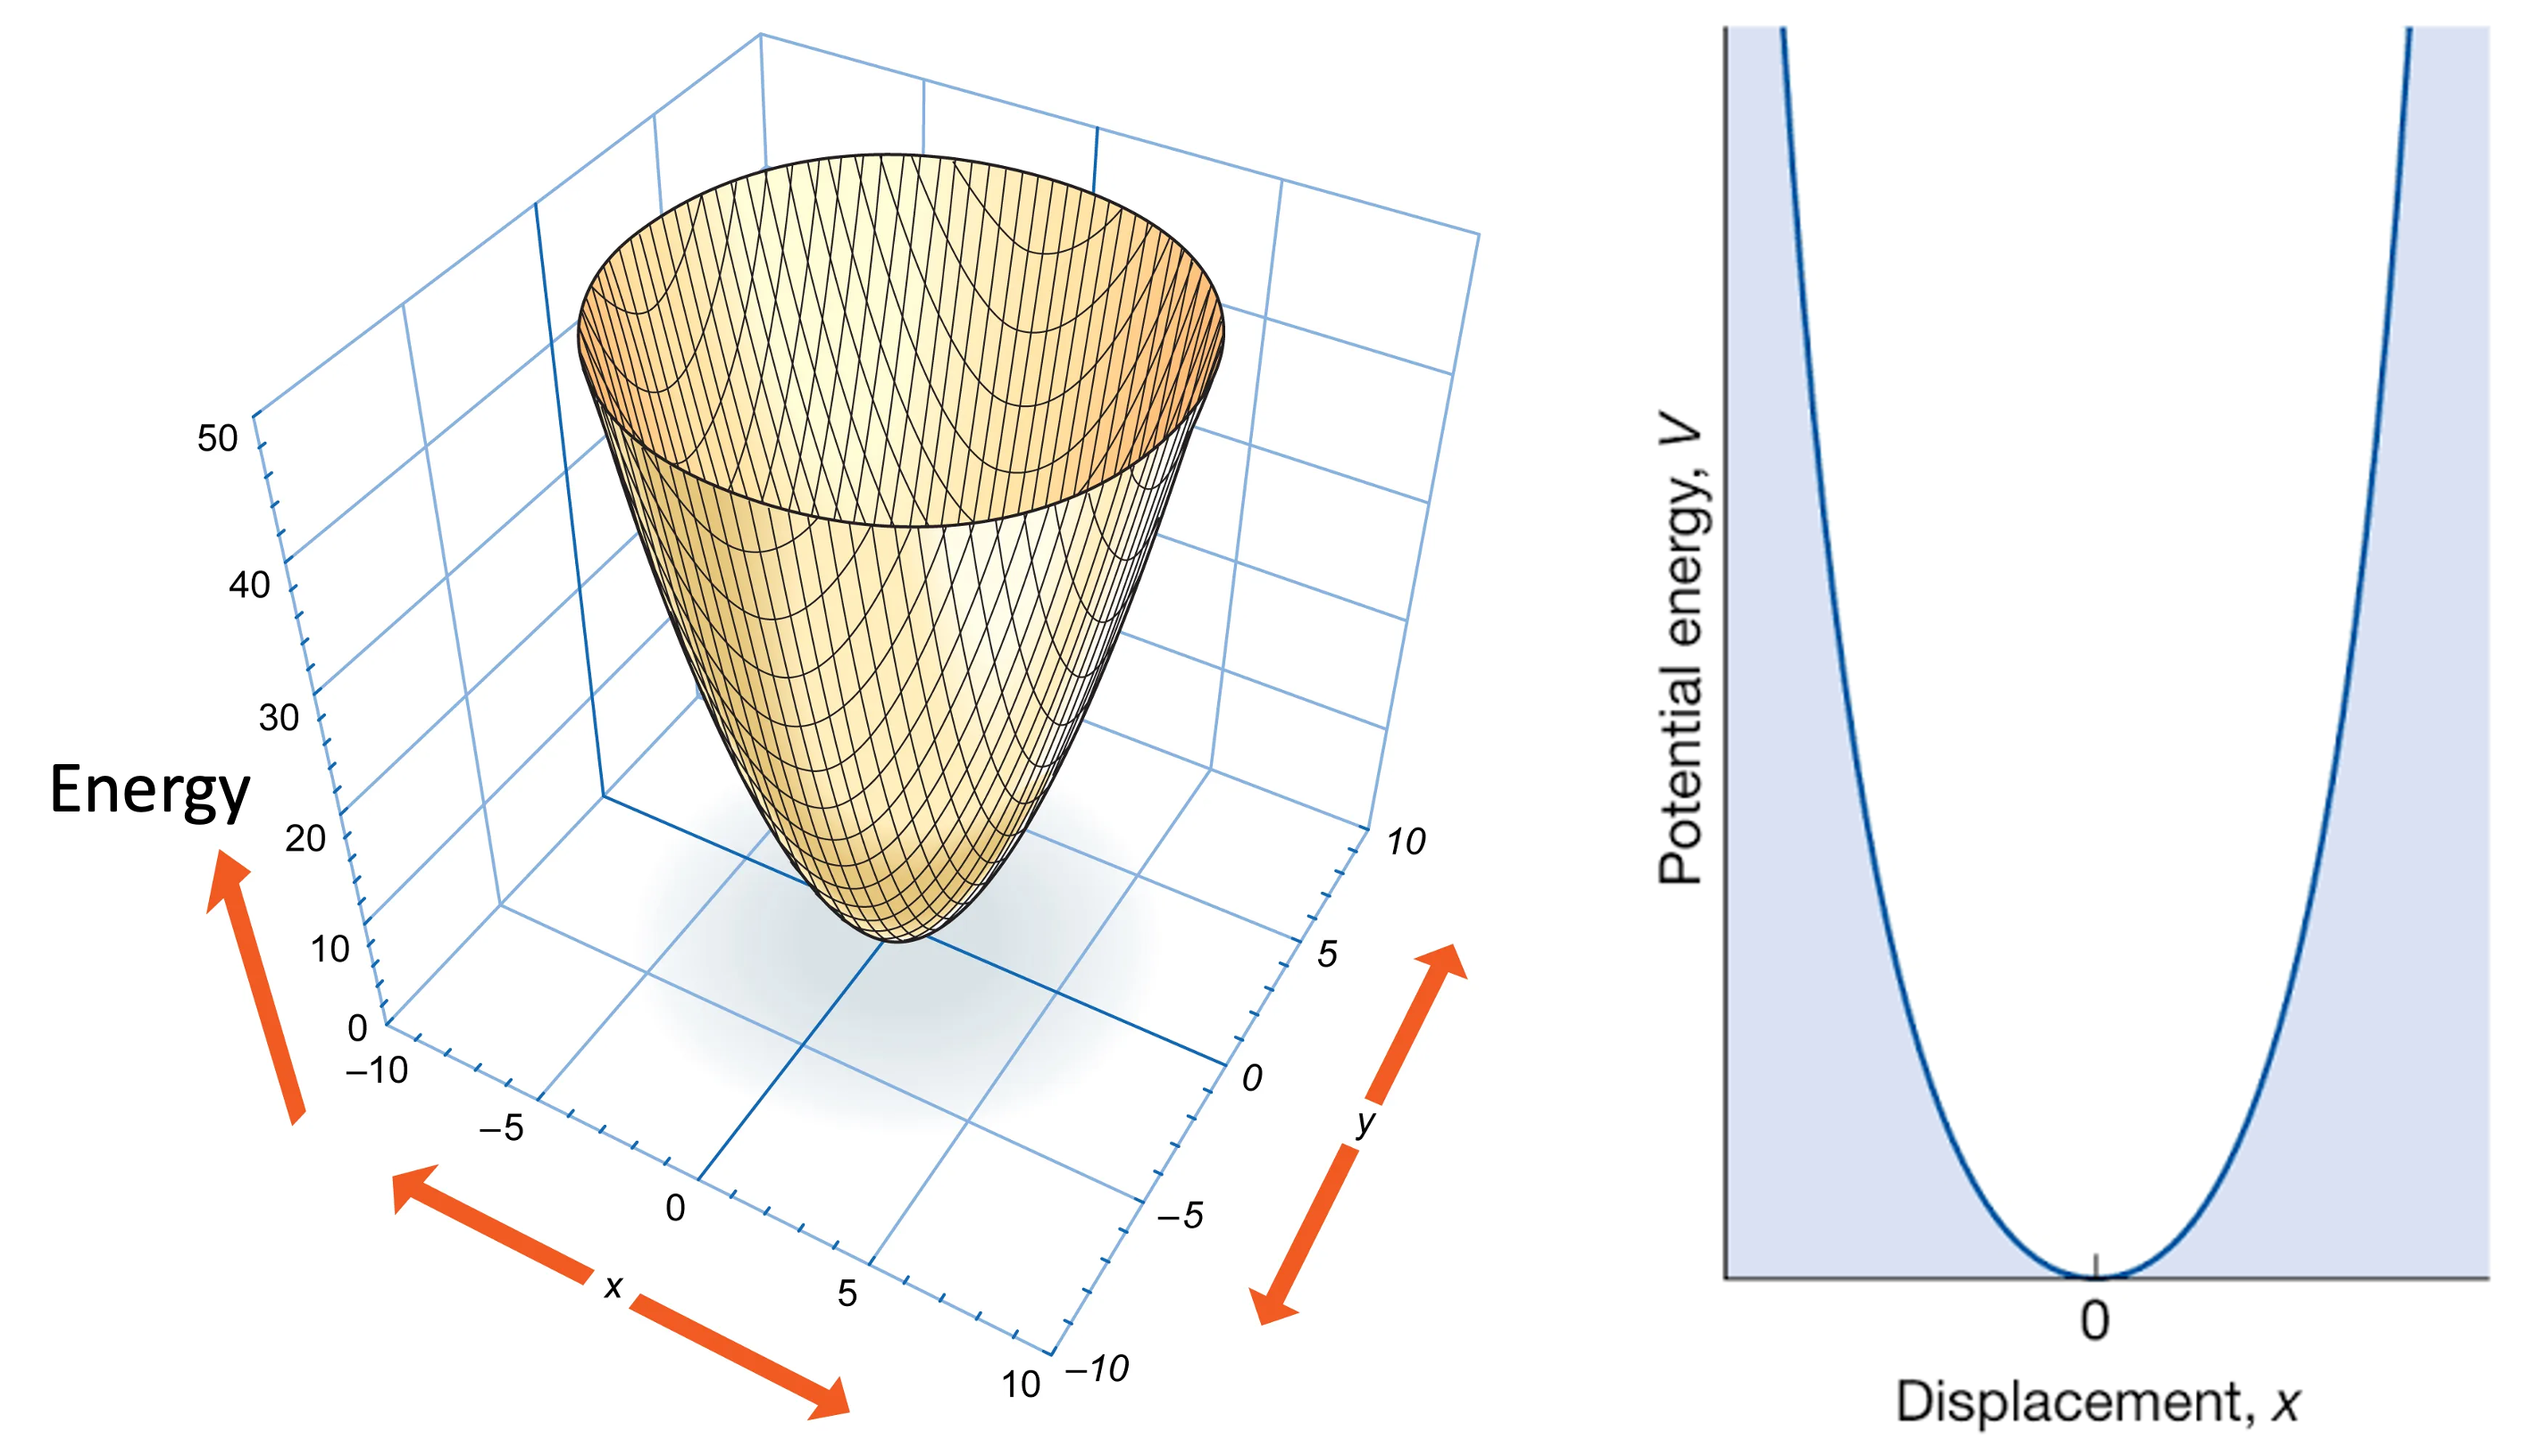
You have likely seen potential energy surfaces before when studying various chemical concepts. For example, in IR spectroscopy, we use potential energy surfaces to describe the energy of chemical bond vibrations. Below is the potential energy diagram of a diatomic molecule's bond stretching mode.
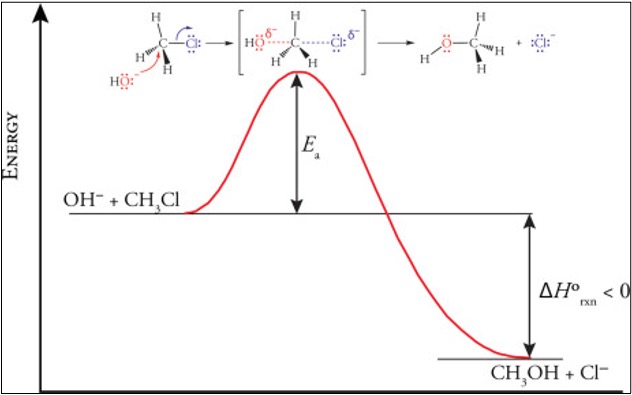
For chemical mechanisms, the energy diagram of a mechanistic step looks like this, with the example of an SN2 reaction of chloromethane with a hydroxide ion:
How the gradient changes as we move across the potential energy surface
Another concept that is worth understanding is how the energy changes as we move across the potential energy surface. We will use this idea repeatedly in the steps below. At any point on the potential energy surface, we can ask two questions:
- What is the gradient (slope) of the energy at this point?
- Is the gradient increasing or decreasing as we move along? In other words, does the energy curve upwards or downwards?
Whether the gradient is increasing or decreasing is described mathematically by the second order derivative of the energy. The animation below shows the difference between these two situations:
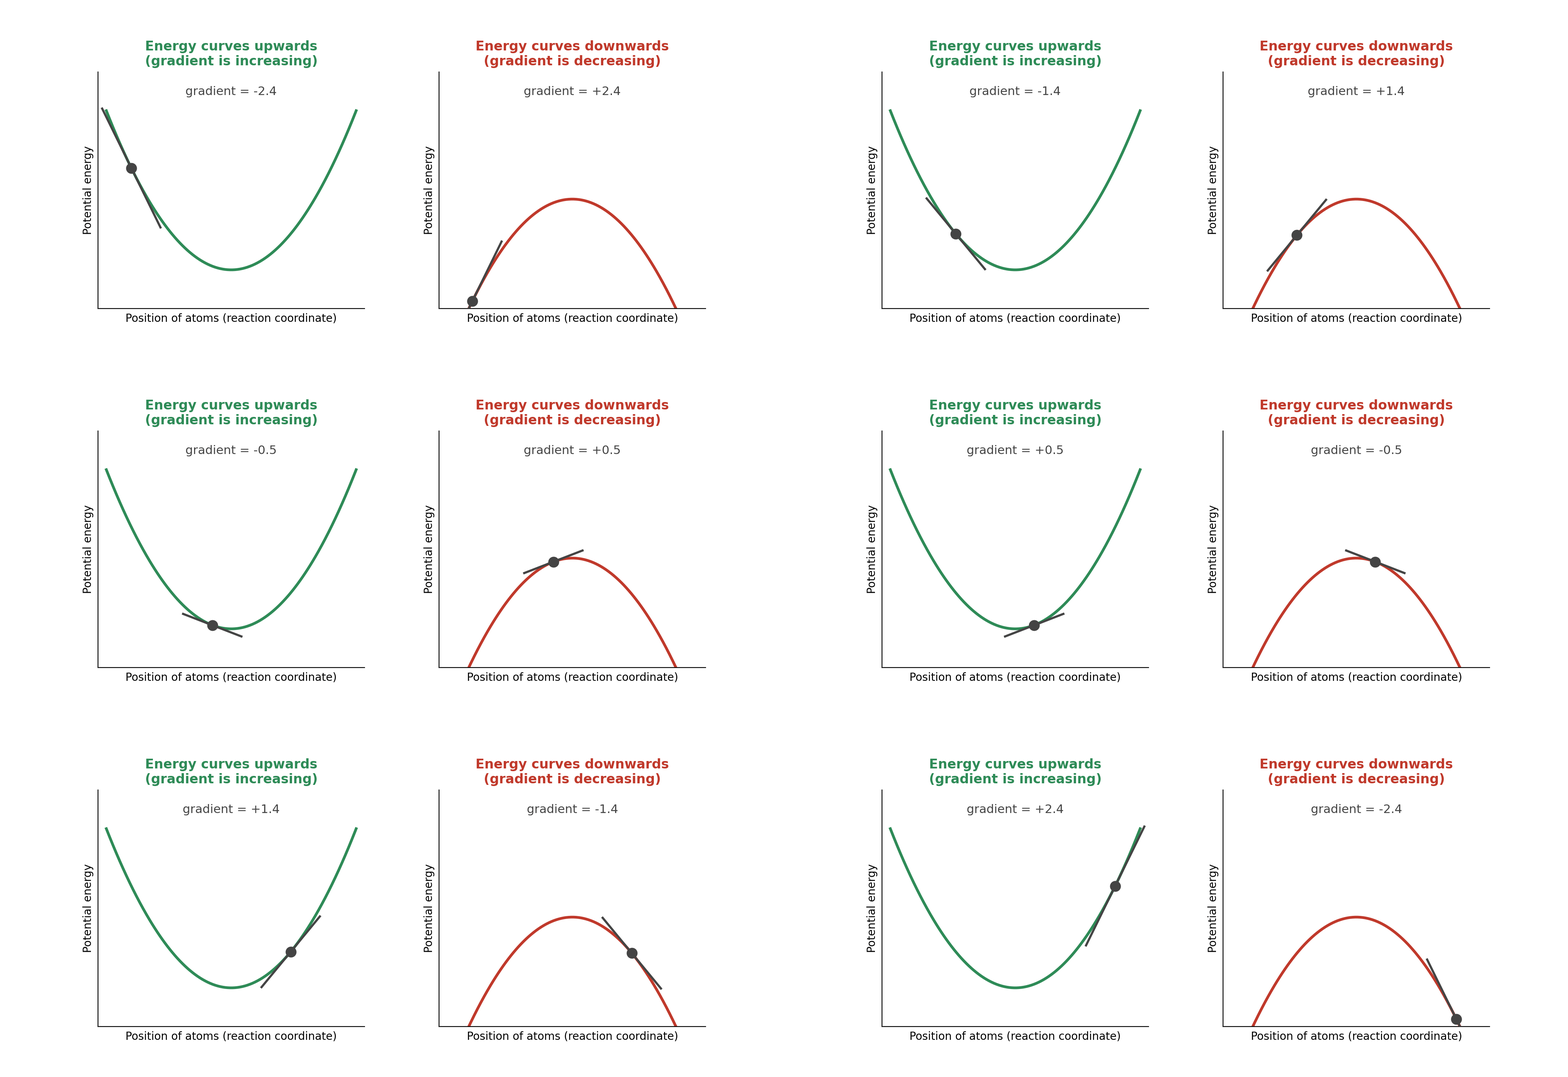
- If the energy curves upwards (left animation), the gradient increases as we move along: it starts negative, passes through zero at the bottom of the well, and becomes positive. This indicates we have a positive second order derivative.
- If the energy curves downwards (right animation), the gradient decreases as we move along: it starts positive, passes through zero at the top of the hill, and becomes negative. This indicates we have a negative second order derivative.
Keep these two pictures in mind, as they are the key to understanding how we recognise reactants and products (Step 1) and transition states (Step 3).
The second order derivative goes by several names
The second order derivative of the energy appears throughout this tutorial (and in chemistry more broadly) under several different names. When you come across any of the following, they are all referring to the same idea:
- Curvature: how the energy curves upwards or downwards, i.e. whether the gradient is increasing or decreasing.
- Hessian: the collection of second order derivatives of the energy with respect to the positions of the atoms (used in Step 3).
- Eigenvalue of the Hessian: the eigenvalues of the Hessian are the second order derivatives of the energy along each vibrational mode. A negative eigenvalue therefore means a negative second order derivative along that mode (used in Step 3).
So when we talk about the "curvature" of the potential energy surface, the "Hessian", or an "eigenvalue of the Hessian", keep in mind that these are just describing the second order derivative of the energy.
Step 1: Locally optimise the reactants and products
The first step in obtaining the transition state is to make sure that the energies of our reactant and product structures are as low as possible. The technical way of saying this is that we optimise the structures until they reach their local minimum energy. If we look at an energy profile, this means they lie in an energy well:
Vibrational frequency analysis can help determine if we are in a local minimum
Because reactants and products lie at a local minimum on the potential energy surface, they have a positive second order derivative along each degree of freedom (bond vibrational modes). I.e., as you move in the positive direction (like the positive x direction), the gradient of the potential energy increases:
We can use vibrational frequency analysis to determine if we have a local minimum or not. Vibrational frequency analysis is the same thing as IR spectroscopy: we look at the vibrational frequencies of our molecules after the chemical compound has been optimised. If all the vibrational frequencies are positive, it means we have found the local minimum, which we expect for our reactants and products. If we do have any negative vibrational frequencies, we need to look at our chemical system again.
Note
Positive frequencies are often called real frequencies or real modes in computational chemistry.
In summary:
All positive (real) frequencies → positive second order derivatives in every direction → confirmation we have a local minimum
Step 2: Locate the transition state
Next, we traverse the potential energy surface from reactants to products (or from products to reactants), taking images of the chemical compound as its structure changes and calculating the energy of each image. As we do this, we learn more and more about the energy landscape for this mechanistic step. This is represented below, where the dots indicate the structure of the image as we scan the potential energy surface from the reactant to the product.
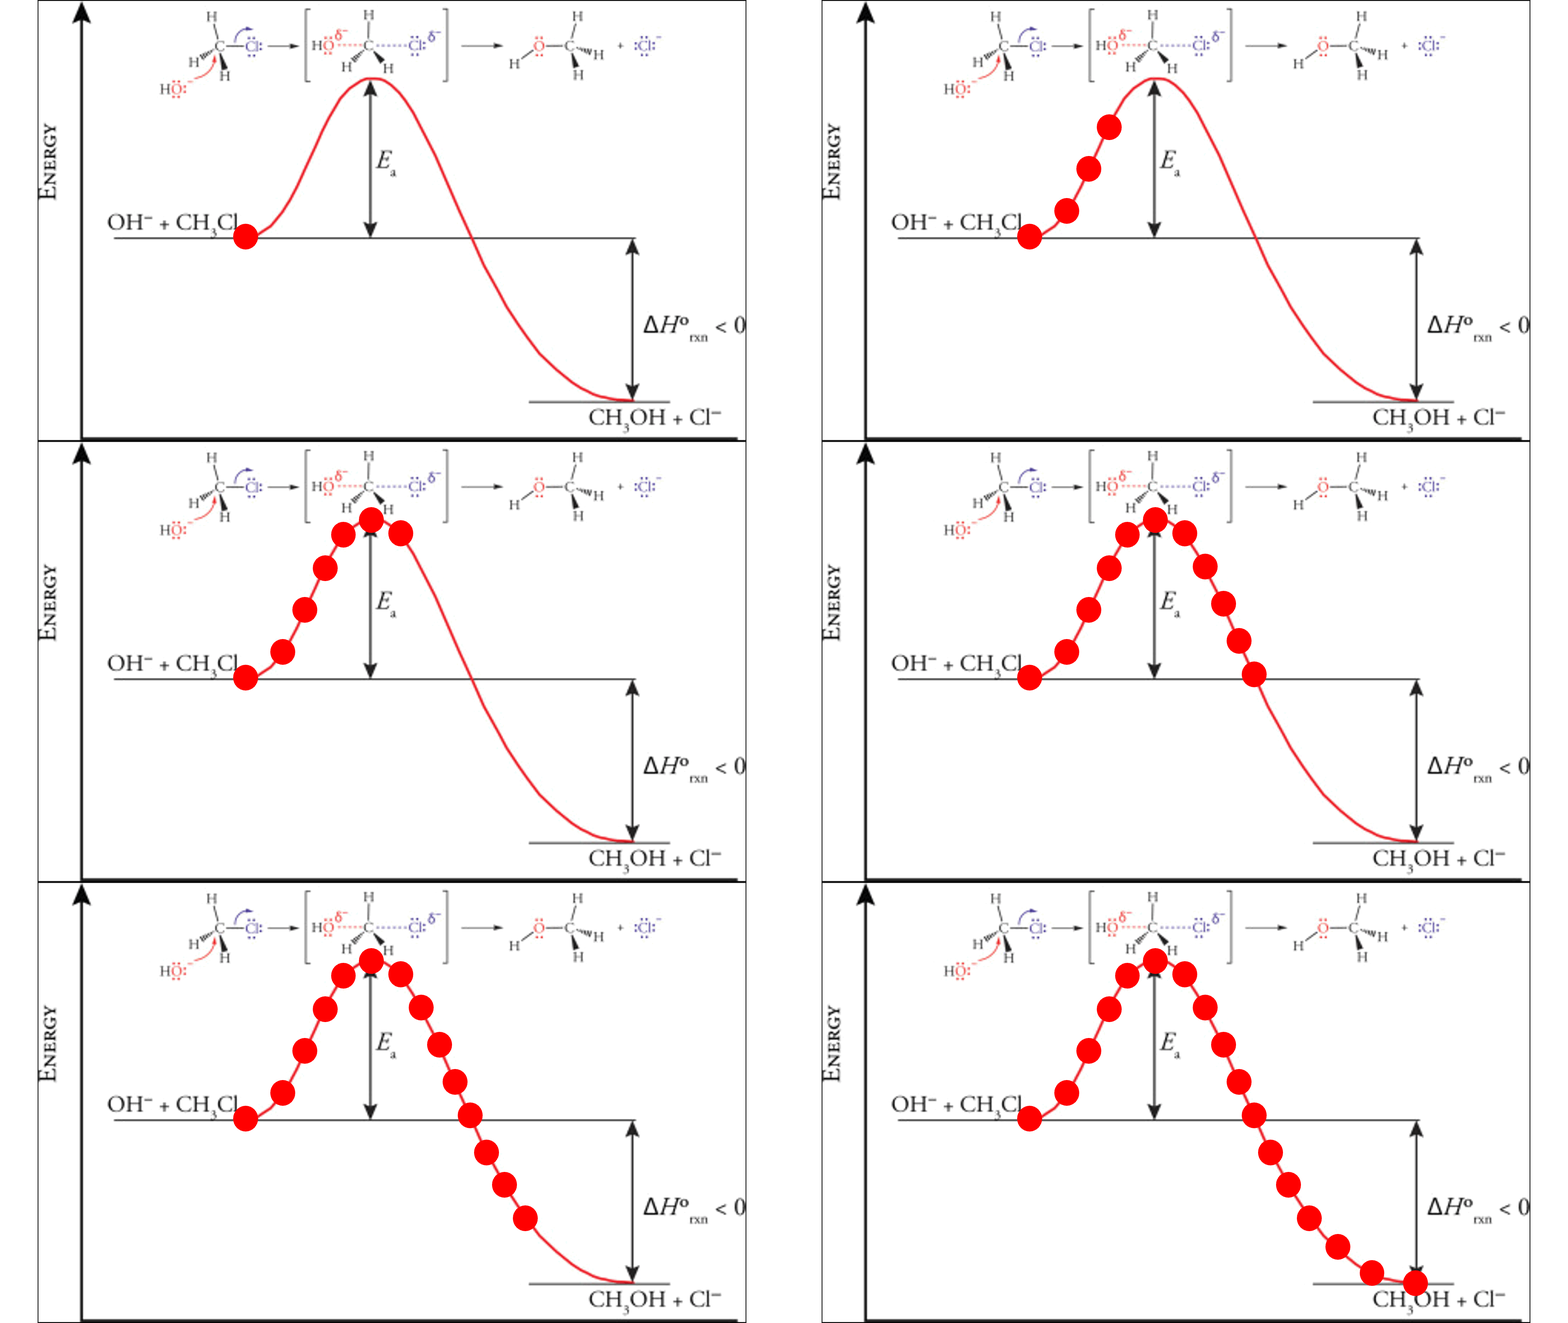
The image with the greatest energy is likely to closely represent the transition state. However, it is likely not the absolute structure for the transition state. For this reason, we also need to optimise the transition state (step 3).
Step 3: Optimise the transition state
We obtained a rough idea of what the transition state looks like in step 2. However, we probably need to optimise this structure further to obtain the exact structure of the transition state.
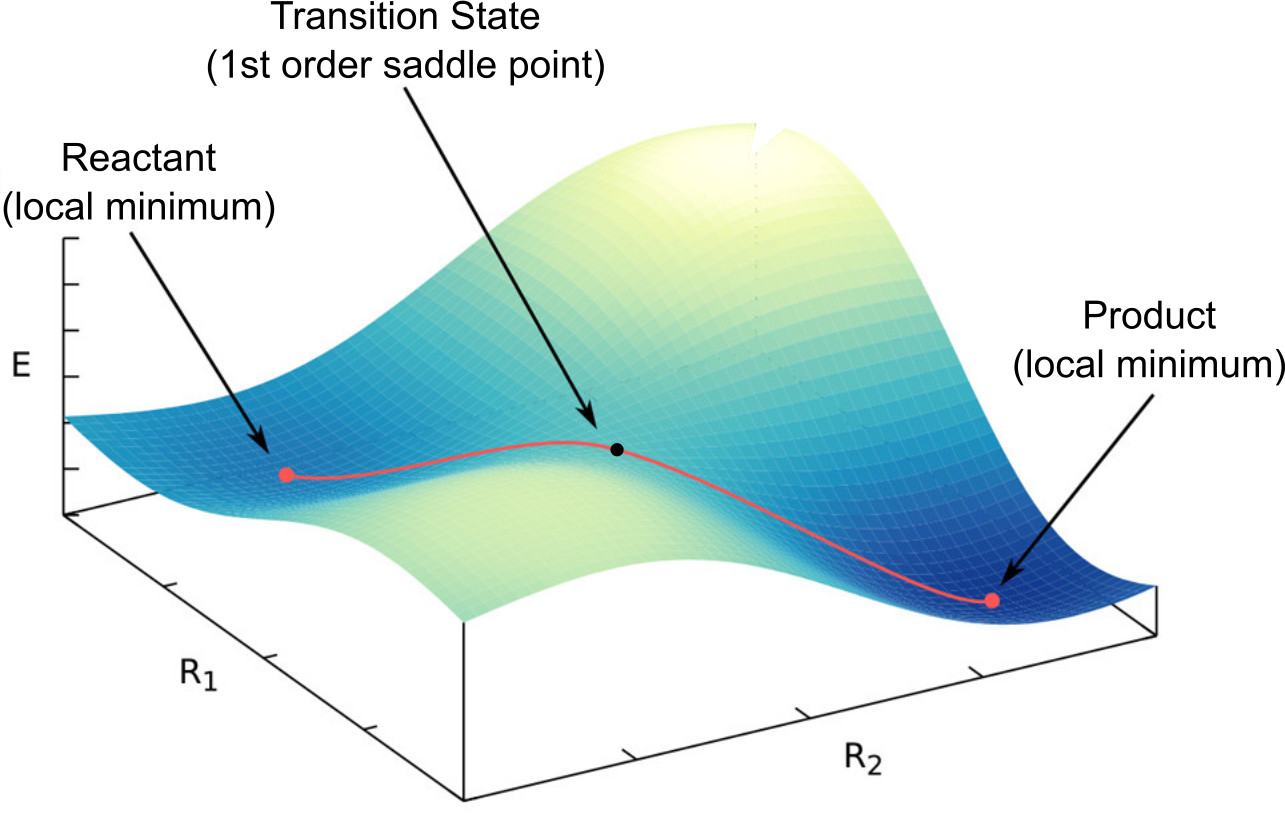
The transition state on the potential energy surface is defined as a saddle point. This means it is the highest energy point along the energy profile from reactants to products, but is still the lowest energy point along every other degree of freedom. This definition is a bit complex, so to make it easier to understand, let's look at the potential energy surface again for the mechanistic step, shown below:
We see that along the red line the transition state is at a maximum, but perpendicular to this the energy is at a minimum. This is called a saddle point. This is the best pathway to get from the reactants to the products.
Vibrational frequency analysis can help determine if we are in a transition state
Vibrational frequency analysis (i.e. IR spectroscopy) is the best way to determine if we have found a transition state. Consider a zoomed-in view of the potential energy surface at the transition state (below):
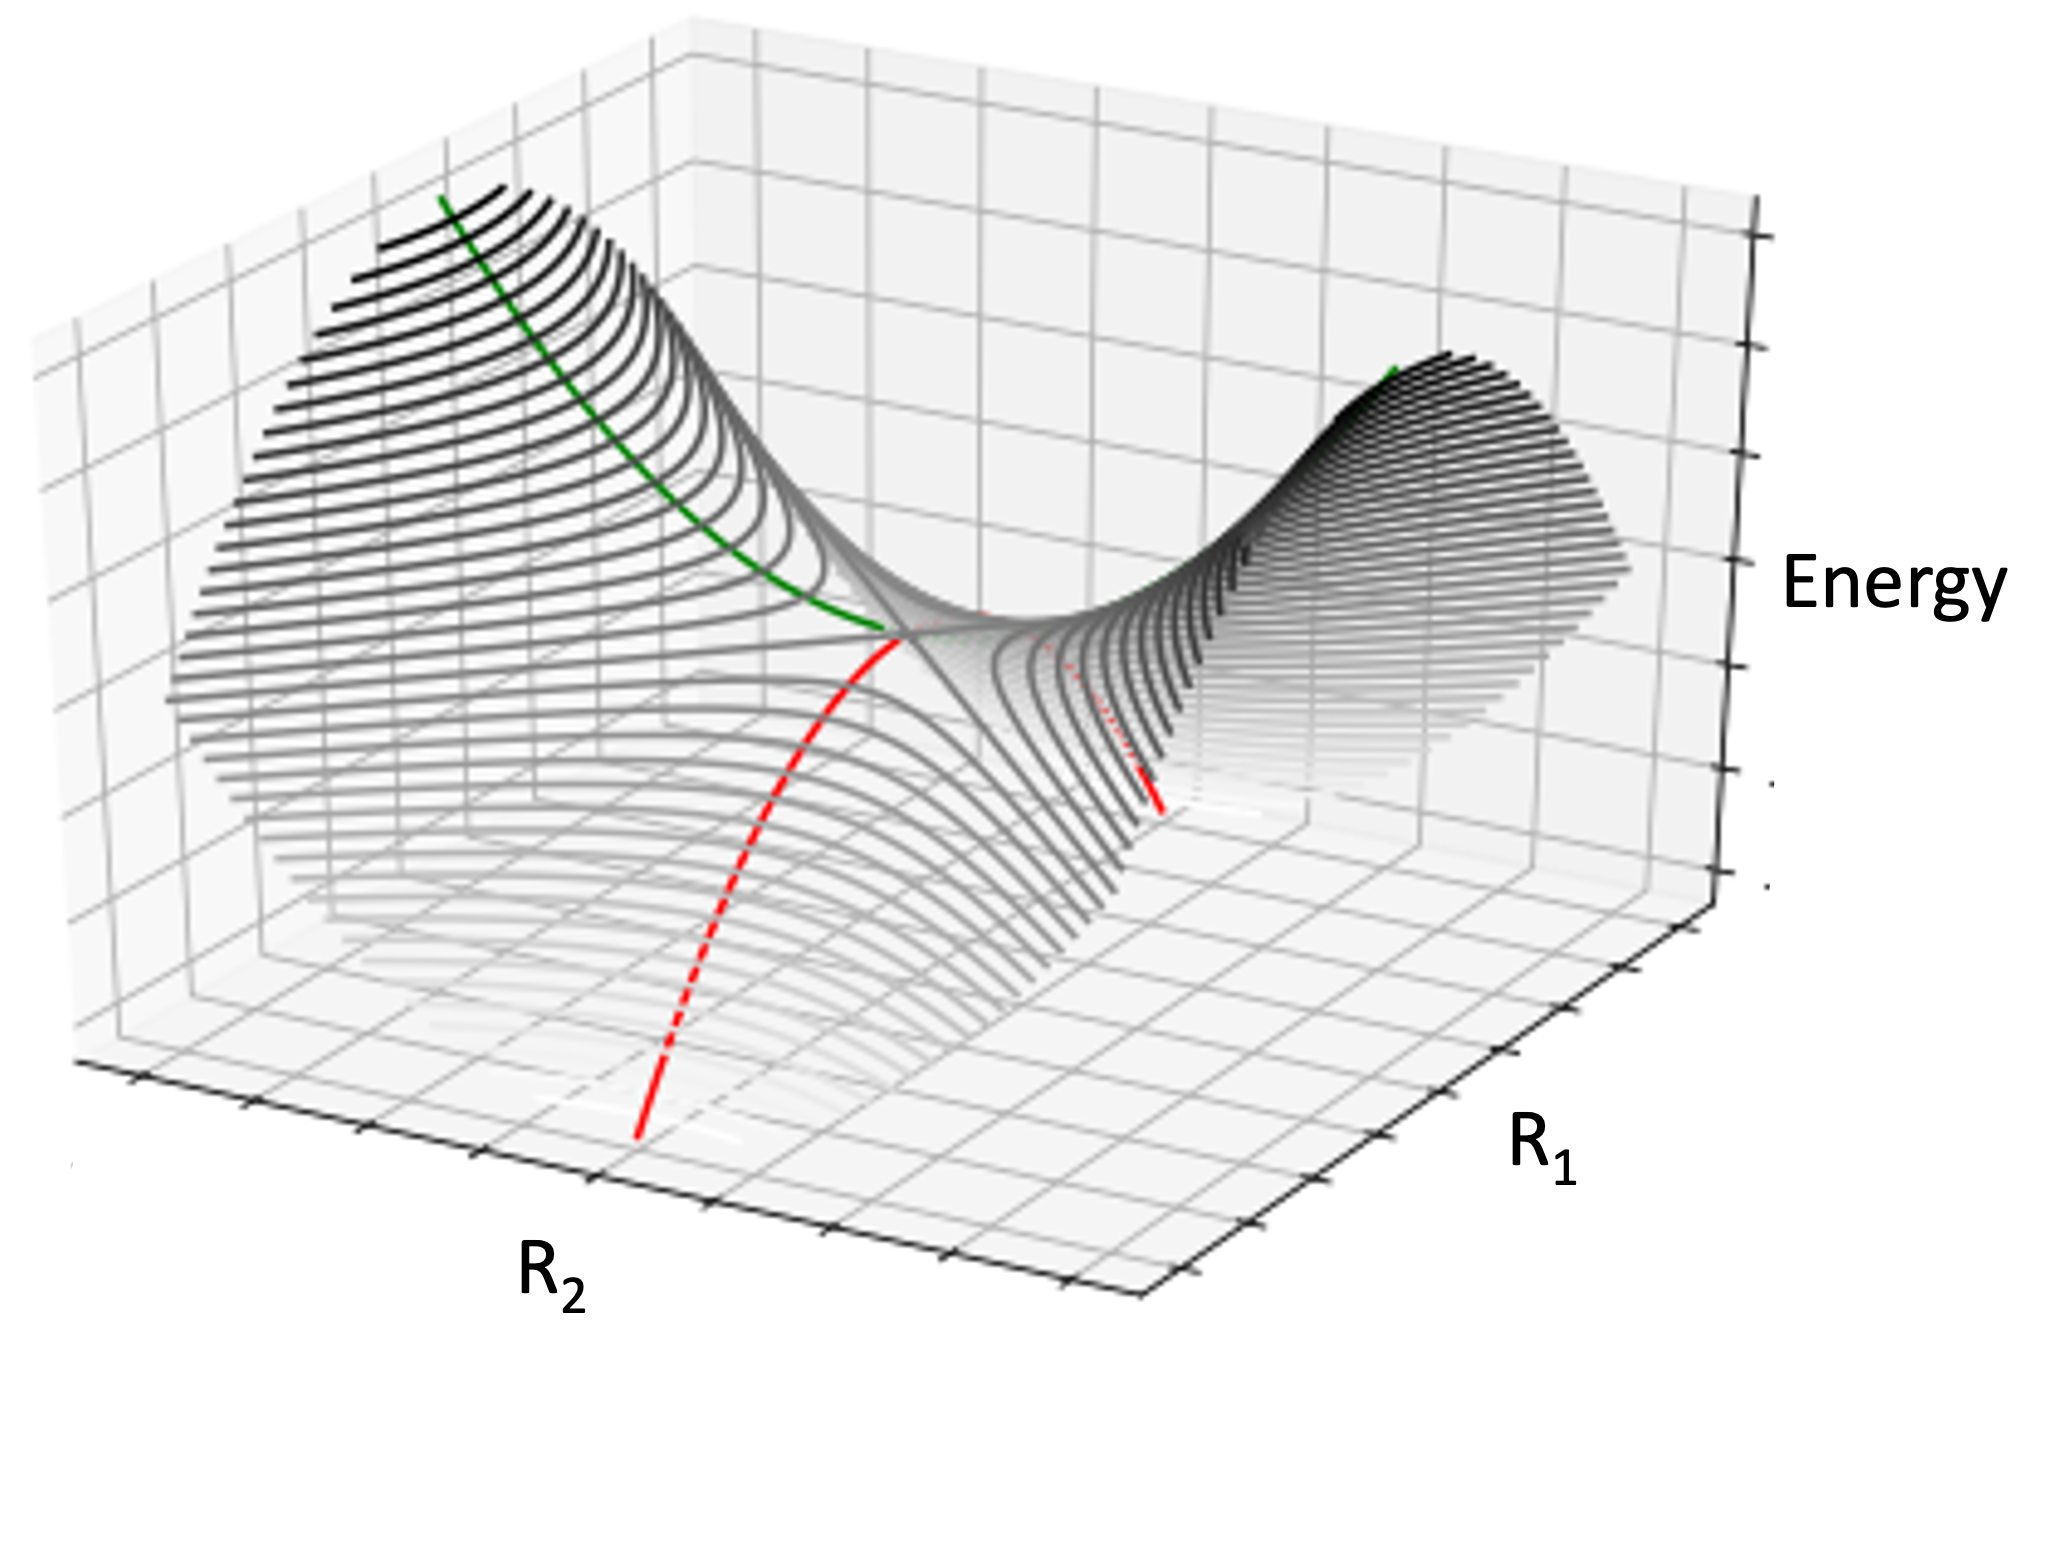
- Along the mechanistic step's energy profile (red line, along R1), the energy curves downwards. This is an example of a negative second order derivative, i.e. the gradient of the energy is decreasing as you move along the R1 direction. This gives a negative vibrational mode.
- Along all other directions perpendicular to the mechanistic step's energy profile (green line, along R2), the energy curves upwards. This is an example of a positive second order derivative, i.e. the gradient of the energy is increasing as you move along the R2 direction. This gives a positive vibrational mode.
The transition state is defined as a structure where all but one of its vibrational modes are positive and one of its vibrational modes is negative. We call that negative vibrational mode an imaginary vibrational mode.
In summary:
All positive (real) frequencies except for one negative (imaginary) frequency → confirmation we have a transition state
Note
- Positive frequencies are often called real frequencies or real modes in computational chemistry.
- Likewise (and as mentioned previous), negative frequencies are often called imaginary frequencies or modes.
Step 4: Validate the transition state
Once we have found the transition state for the mechanistic step, we finally want to verify that it connects our reactants to our desired products. This is because steps 2 and 3 allow us to find a transition state, but step 4 allows us to make sure we have found the right transition state.
How do we verify this in practice?
The negative vibrational mode gives the direction along the reaction pathway from reactant to transition state to product. What we do is slightly "push" the transition state in each of these two directions, then perform a local optimisation on each of the two resulting structures. This method is called the intrinsic reaction coordinate (IRC) method.
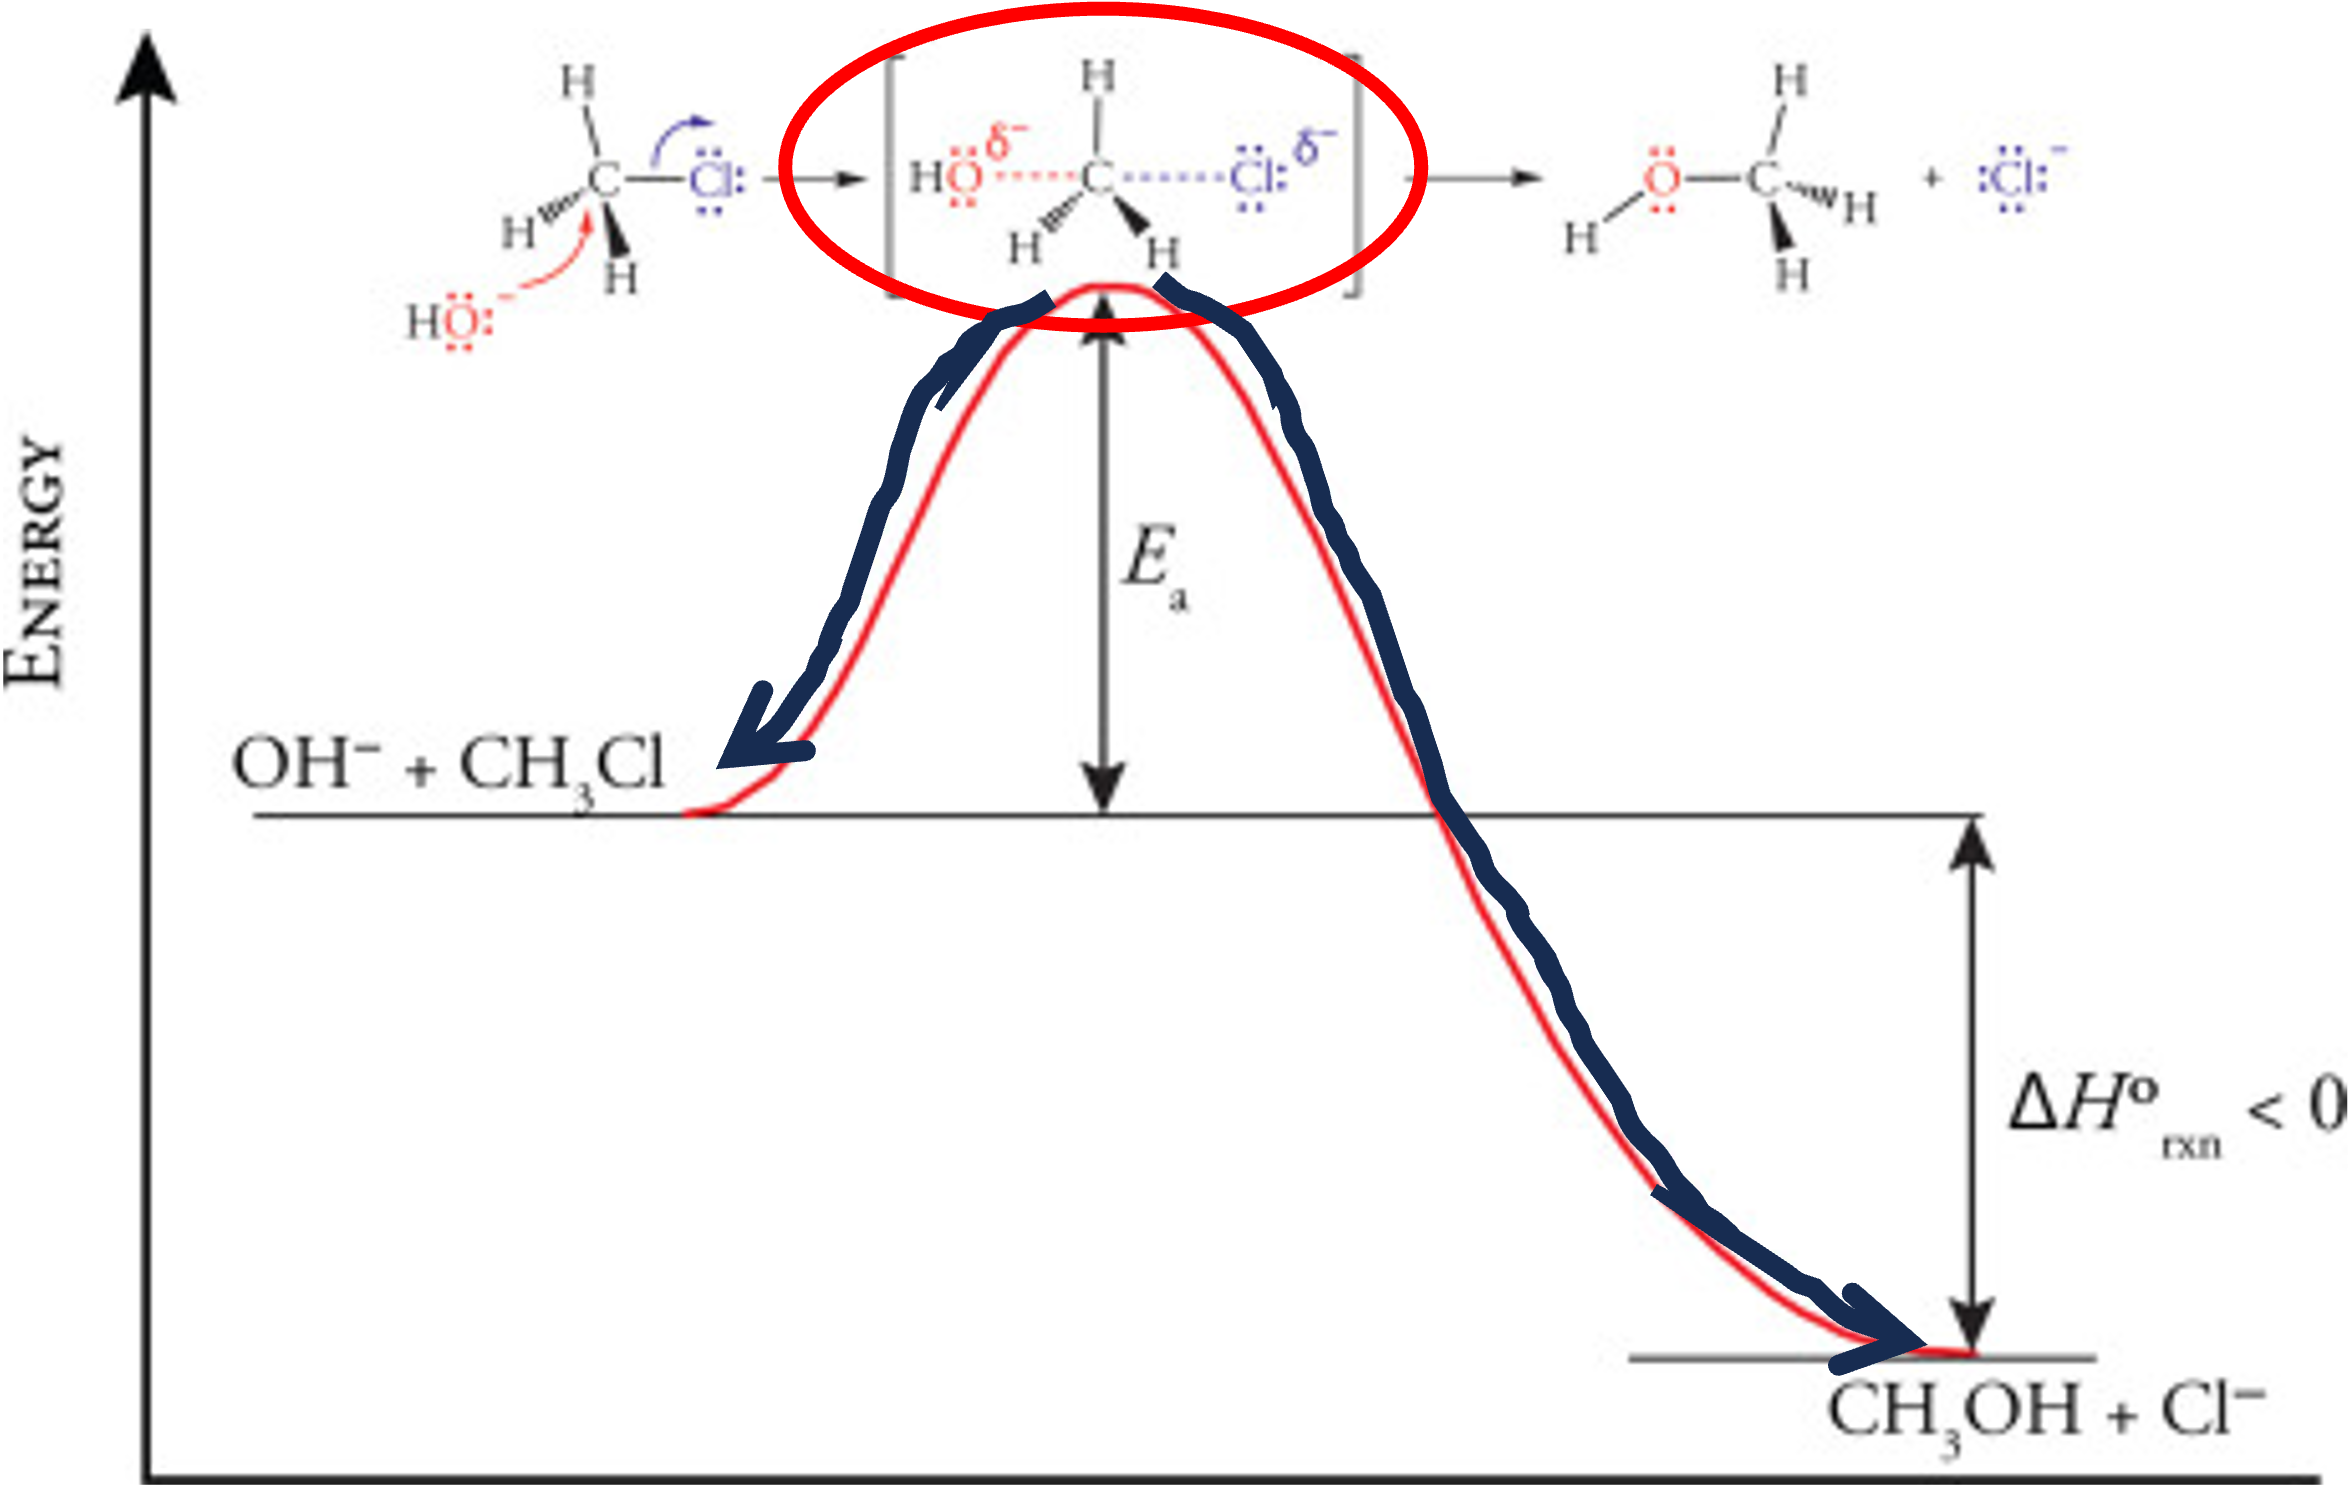
This method is successful if the two local optimisations lead back to our original reactant and product structures. If they do, we have confirmed that our transition state truly connects our reactants to our products.